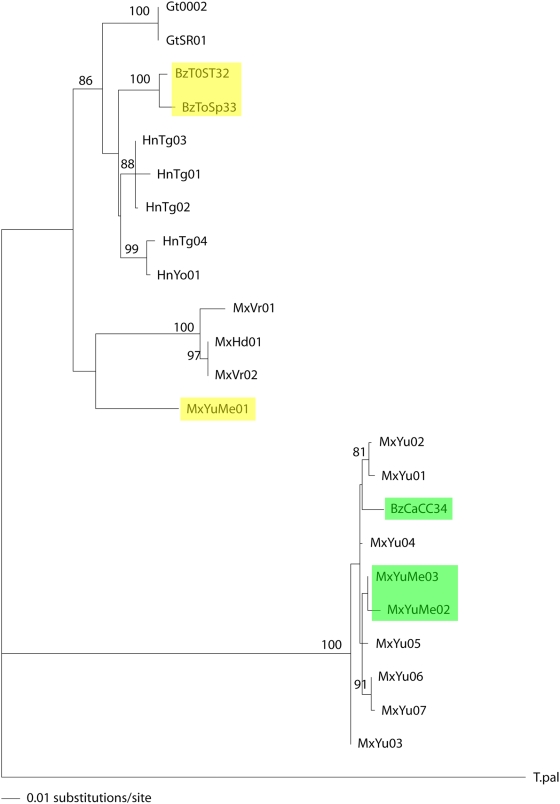
Figure 5. Phylogenetic maximum likelihood tree of all 23 distinct mt cyt b sequences of T. dimidiata.
Number of substitutions per site is indicated by the bar and bootstrap values higher than 75% are indicated at the nodes. See Table 2 for sample ID. T. pallidipennis is the outgroup. ITS2 Group 2 is shown in yellow and Group 3 in green.

