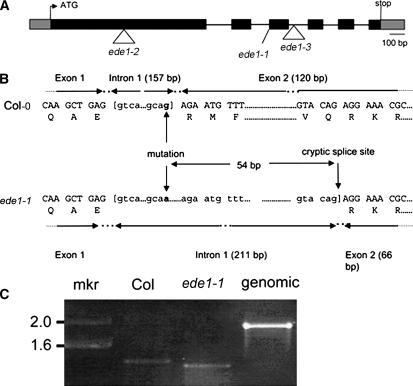
Figure 3.
Structure of the EDE1 Gene.
(A) Blocks denote exons, and lines denote introns. The ede1-1 allele contains a G-to-A base transition at +1066, ede1-2 contains an insertion of T-DNA into exon 1 (+414), and ede1-3 contains an insertion of T-DNA into intron 2 (+1231). The sequence of a cDNA (GenBank BX818775) was used to define the 5′ and 3′ untranslated regions, shown as gray boxes.
(B) Detail of DNA and amino acid sequences surrounding the ede1-1 mutation in Columbia (Col) and ede1-1. Comparison of ede1-1 and Col cDNA sequences shows that the G-to-A polymorphism at +1066 removes the exon1/intron1 splice site and that the ede1-1 mutant plant uses a cryptic splice site at +1120 instead.
(C) RT-PCR of At2g44190 transcript from total RNA isolated from young siliques of Col wild-type and homozygous ede1-1 plants. Product from genomic DNA is shown as control. mkr, marker (kb).

