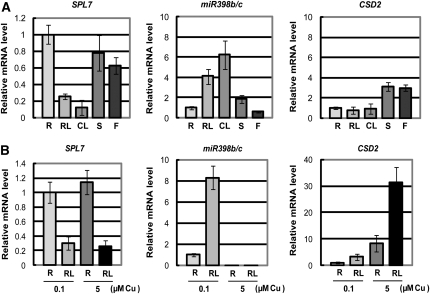
Figure 6.
SPL7 Expression Patterns.
(A) Quantitative RT-PCR analysis of tissue-specific expression. Plants were grown for 3 weeks on MS agar medium containing 5 μM CuSO4 for the preparation of roots (R) or for 5 weeks on soil for the preparation of rosette leaves (RL), cauline leaves (CL), stems (S), and flowers (F). Error bars indicate sd (n = 3).
(B) Quantitative RT-PCR analysis of the response to copper deficiency. Roots (R) and rosette leaves (RL) were harvested from seedlings grown for 3 weeks on MS medium containing 0.1 or 5 μM CuSO4. Error bars indicate sd (n = 3). The primer sequences are described in Supplemental Table 6 online.

