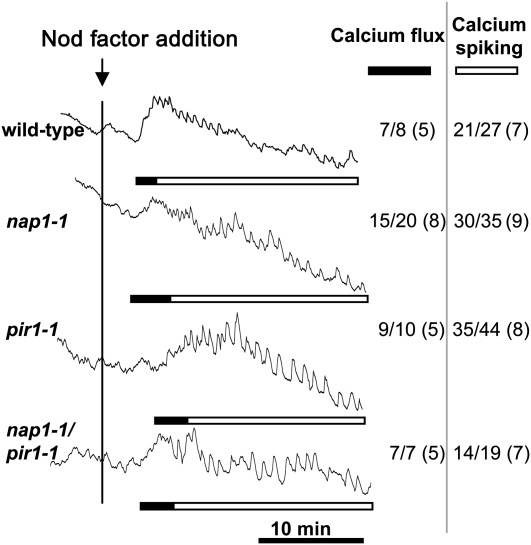
Figure 9.
Nod Factor–Induced Calcium Flux and Calcium Spiking in L. japonicus nap1-1, pir1-1, and pir1-1 nap1-1 Mutants.
Calcium levels were monitored in individual root hairs of the wild type and nap1-1, pir1-1, and pir1-1 nap1-1 mutants following addition of 100 nM M. loti Nod factor (black vertical line). The ratios (arbitrary units) of fluorescence of Oregon Green (calcium sensitive) to Texas Red (calcium insensitive) were recorded every 5 s for >30 min. The number of cells showing calcium spiking or calcium flux is shown in the inset table as a fraction of the total number of cells analyzed (with the total number of plants tested in parentheses). Solid bars indicate region of the trace where there is a significant transient increase in cellular calcium particularly at the root tip compared with other cytoplasmic or nuclear regions, and the open bars indicate the parts of the traces showing nuclear-associated calcium spiking.

