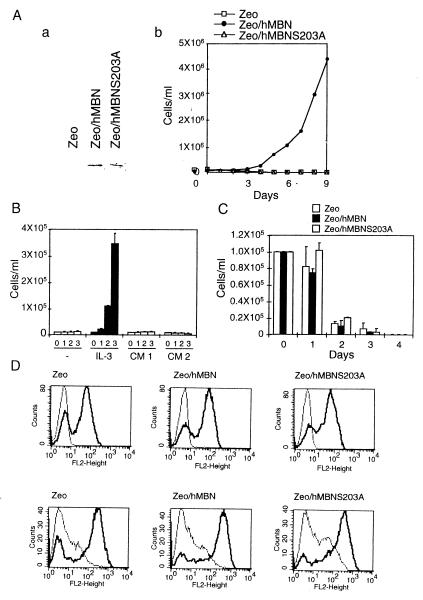
Figure 2.
MBN is critical to transformation to factor-independent growth; requirement of the G-CSFR. (A) Semiquantitative immunodetection of MBN in zeocin-resistant cells (a) and growth (b) of zeocin-resistant Ba/F3/G-CSFR cells after transfection of 5 μg of the pcDNA3.1/Zeo (Zeo), pcDNA3.1/Zeo/hMBN (Zeo/hMBN), or pcDNA3.1/Zeo/hMBNS203A (Zeo/hMBNS203A) in factor-free medium. In b, the experiment was repeated three times with similar results with independent zeocin-resistant Ba/F3/G-CSFR cells. (B) An autocrine loop is not involved in pcDNA3.1/Zeo/hMBN-transfected Ba/F3/G-CSFR cells expressing the wild-type MBN. Growth capacity of wild-type Ba/F3/G-CSFR cells cultured in conditioned medium from factor-independent Ba/F3/G-CSFR cell lines expressing MBN. Cells were washed three times in factor-free RPMI 1640 medium and 1 × 10⁵ cells per ml were cultured in factor-free medium (−), IL-3 (0.1 ng/ml), or conditioned medium from two factor-independent Ba/F3/G-CSFR cell lines expressing the wild-type MBN (CM1 and CM2). Cell concentrations at days 0, 1, 2, and 3 are indicated. Error bars indicate SDs from the results of three independent experiments. (C) Requirement of G-CSFR. Growth of zeocin-resistant Ba/F3 cells after transfection of 5 μg of the pcDNA3.1/Zeo (Zeo), pcDNA3.1/Zeo/hMBN (Zeo/hMBN), or pcDNA3.1/Zeo/hMBNS203A (Zeo/hMBNS203A) in factor-free medium. Cell counts were obtained at days 0, 1, 2, 3, and 4. The experiment was repeated three times with two independent zeocin-resistant Ba/F3 cells giving similar results. Error bars indicate SDs from the results of three independent experiments. (D) MBN does not affect cell-surface expression and binding capacity of the G-CSFR in Ba/F3/G-CSFR cells. Flow cytometric analysis of G-CSFR expression (Upper) and binding capacity (Lower) on pools of Ba/F3/G-CSFR cells expressing the control (Zeo), wild-type (Zeo/hMBN), or mutant (Zeo/hMBNS203A) MBN. Cells were stained with either biotinylated mouse anti-human G-CSFR antibodies or biotinylated G-CSF. This step was followed by phycoerythrin-conjugated streptavidin (bold curve). Left part of bold curves represents negative cells. (Upper) Light curves are without the anti-G-CSFR step. (Lower) Light curves are with a 7-fold excess nonbiotinylated G-CSF competitor. All samples were analyzed for fluorescence (FL2-Height).

