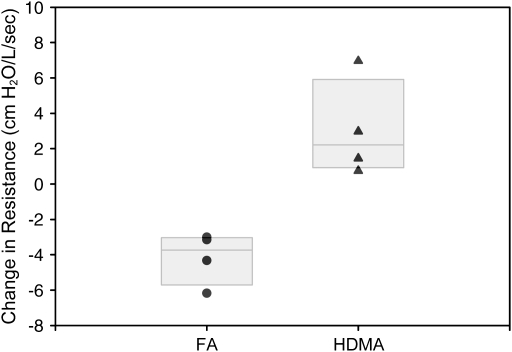
Figure 2.
Airway resistance. Change in airway resistance in each animal over the course of exposure protocol. Filtered-air (FA) animals are compared with HDMA-treated animals. Over the course of the treatment protocol, HDMA-treated animal developed a significant increase in airway resistance as compared with FA animals (p = 0.0037). Individual animal values are plotted with boxes representing 50% of the values and the median line.

