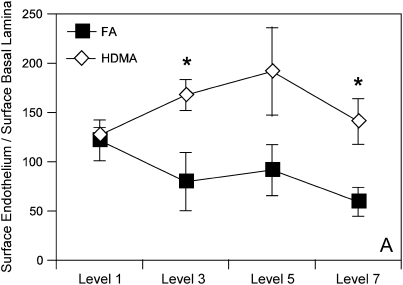
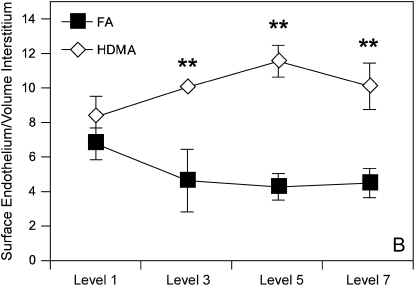
Figure 5.
Morphometry. (A) Surface of endothelium to surface of the epithelial basement membrane. Random intersections of bronchial vessel as a ratio to intersections of epithelial basement membrane at each airway generation. Error bars designate variability within each group at that airway generation. Significant values represented by single asterisks and include p = 0.039 (airway generation 3), p = 0.025 (airway generation 7). (B) Surface of endothelium to the volume of interstitium determined by quantitating intersection of endothelium expressed in a ratio with random point density of interstitium at each airway generation. Values are means ± SE and represent variation of the group at each airway generation. Significant values are represented by double asterisks and include surface of endothelium to volume of interstitium, p = 0.024 (airway generation 3), p = 0.009 (airway generation 5), p = 0.012 (airway generation 7).


