
Figure 7. PPARα activation in the microglia leads to negative regulation of the AP-1 pathway.
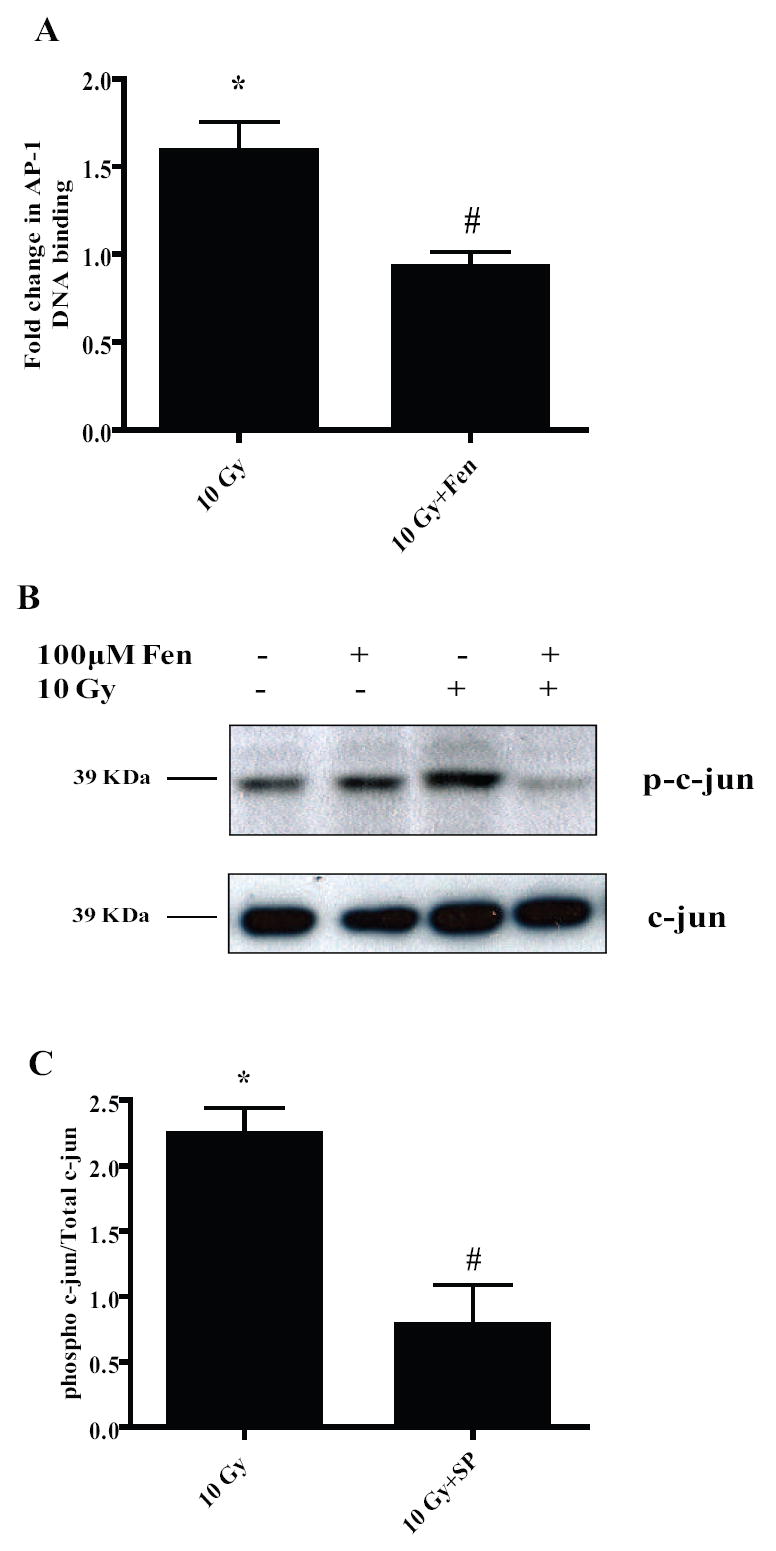
A, BV-2 cells were treated with vehicle or 100 μM Fenofibrate, irradiated and nuclear proteins were collected 1 h post-irradiation and used for EMSA using radiolabeled AP-1 consensus oligos. Results are presented as fold changes compared to sham-irradiated cells. Mean ± S.E.M; *, p< 0.05 vs. sham-irradiated cells; #, p< 0.05 vs. 10 Gy; n = 3. B, Nuclear extracts from A were subject to western blotting for phospho-c-jun. Total c-jun was used as the loading control. Results are representative of two independent experiments (n = 2). C, BV-2 cells were treated with vehicle or 5 μM SP600125 for 1 h, irradiated using a single dose of 10 Gy and nuclear proteins isolated and subjected to immunoblotting for phospho-c-jun. Total c-jun was used as the loading control; results are presented as fold changes compared to sham-irradiated cells. Mean ± S.E.M; *, p< 0.05 vs. sham-irradiated cells; #, p< 0.05 vs. 10 Gy; n = 3.