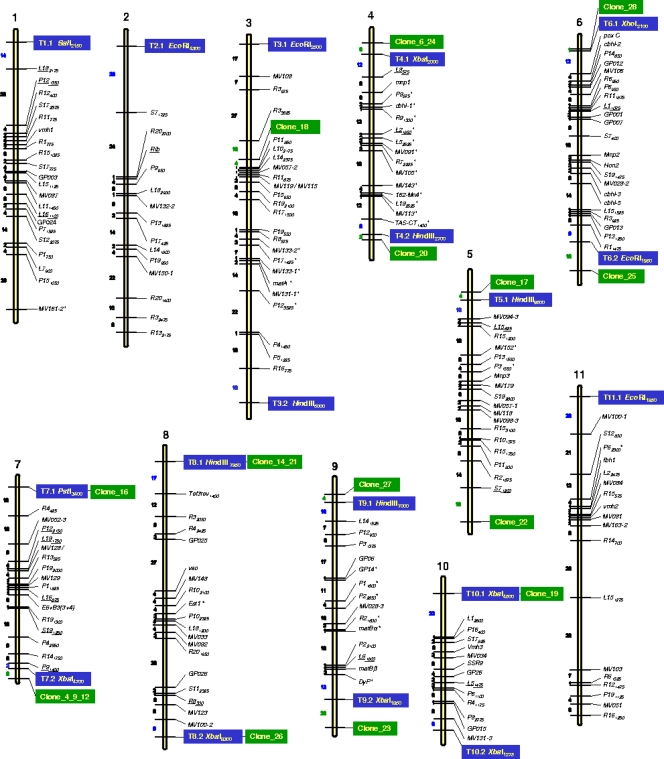
FIG. 3.
P. ostreatus genetic map containing the TRFs (blue boxes) and clones (green boxes) assigned to and incorporated into different LGs. Marker names are listed on the right. The dashes across the linkage lines indicate the locations of the markers. Map units (cM) are indicated on the left of dashes for each LG. Markers that deviated from the expected 1:1 segregation (P < 0.05) appear with an asterisk to the right of the marker name.

