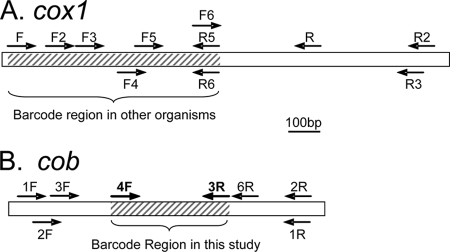
FIG. 1.
Schematic diagram showing locations of primers designed for cox1 (A) and cob (B) barcoding markers. Lengths of genes are indicated by the scale bar in the middle. (A) The hatched area indicates a conventional DNA barcode region (embraced by primer set FR5 or FR6). The expected lengths of the PCR products for all primer sets are as follows: for FR2 and FR3, 1.4 kb; for F2R2 and F2R3, 1.2 kb; for F3R2 and F3R3, 1 kb; for FR5 and FR6, 0.7 kb; and for F2R5 and F2R6, 0.6 kb. (B) The hatched area indicates the cob region that is identified as a potential barcode region in this study. The expected lengths of the PCR products for all primer sets are as follows: for 1F1R and 1F2R, 1 kb; for 1F3R, 0.73 kb; for 1FR6, 0.79 kb; for 2F1R and 2F2R, 0.96 kb; for 2F3R, 0.69 kb; for 2FR6, 0.75 kb; for 3F1R and 3F2R, 0.92 kb; for 3F3R, 0.65 kb; for 3FR6, 0.71 kb; for 4F1R and 4F2R: 0.66 kb; for 4F3R, 0.38 kb; and for 4F6R, 0.44 kb.

