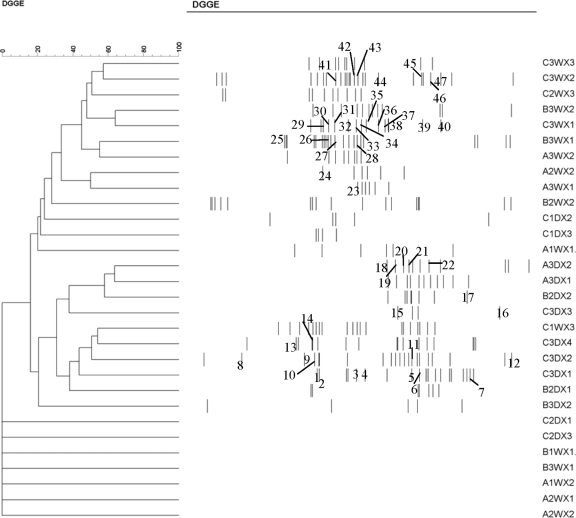
FIG. 5.
Dendrogram generated by an UPGMA cluster analysis comparison of DGGE patterns from direct amplification of samples collected from three farms. In the sample code, A, B, and C refer to the farms, and the numbers 1, 2, and 3 immediately following indicate the sampling phases. W and D refer to water or dry habitat, respectively, while X1, X2, X3, and X4 represent the different broiler houses at one farm. Similarity is expressed as a percentage value of the Dice correlation coefficient. The numbers refer to the excised bands (see Table S2 in the supplemental material).

