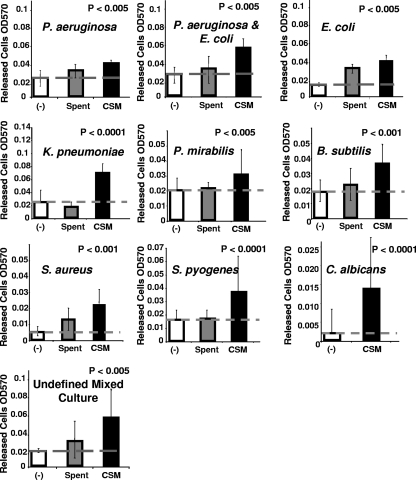
FIG. 4.
Dispersion of different bacterial biofilms by P. aeruginosa CSM using microtiter plate dispersion bioassay. The y axis indicates the number of cells released into the bulk liquid of 16 replicate wells in three replicate experiments, after treatment for 1 h with CSM or carrier control (−), containing sterile medium. Hatched line indicates level of dispersion in carrier control samples. All differences between CSM samples and controls are statistically significant at the indicated P value as determined by using the Student t test.

