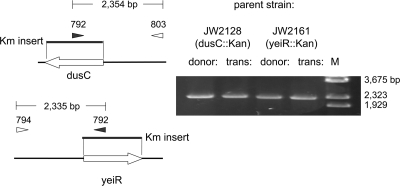
FIG. 8.
Analysis of Kanr transconjugants by PCR. The locations of the primers (Table 1) and the expected sizes of the PCR products are shown on the left. On the right, PCR results for donor and transconjugant after mating, displayed on 1.2% agarose gel are displayed. The marker is BstEII-digested λ DNA.

