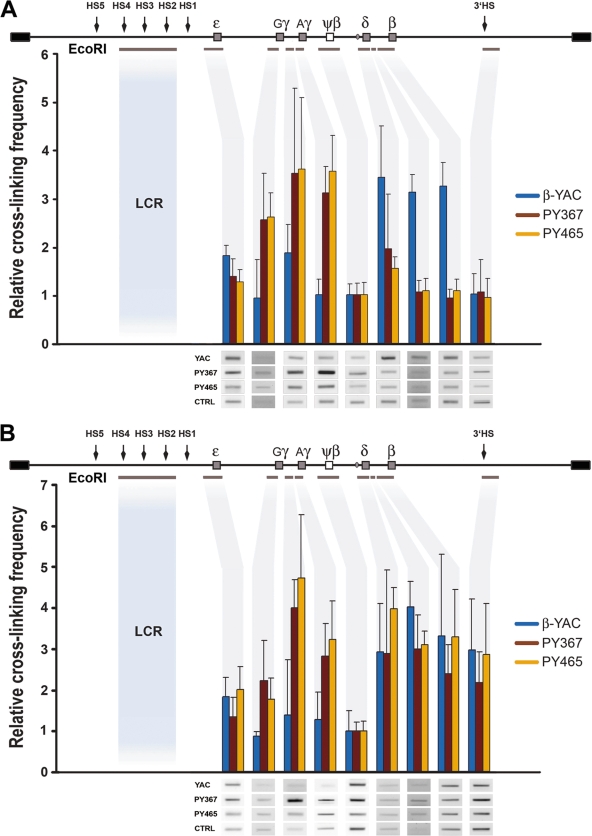
FIG. 6.
Spatial proximity of the LCR to the different regions of the β-globin locus by 3C. A schematic linear representation of the human β-globin locus is shown above each graph. Individual hypersensitive sites (arrows), globin genes (gray boxes), the ψβ pseudogene (open box), and individual fragments below the locus (gray lines) indicate the regions analyzed, and corresponding fragment quantification (gray shadow) is depicted in the histogram. (A) Relative cross-linking frequencies observed at e12.5 between the LCR EcoRI fragment (HS2 to HS4) and the rest of the locus (ɛ, Gγ, inter-Gγ-Aγ, Aγ or PBGDAγ, ψβ, δ, inter-δ-β, β, and 3′HS). Fetal liver cells were from the transgenic β-YAC line and two PBGDAγ-YAC lines (PY367 and PY465) (n = 3 pools with 3 or 4 livers/pool). Values of relative proximity (mean ± SD for each line) were determined for each EcoRI fragment/region (gray shadow) and normalized to the ψβ region, arbitrarily set at 1. The P values were determined by ANOVA (P < 0.002 for the fetal region [Gγ, inter-Gγ-Aγ, and Aγ or PBGDAγ] for line PY367 or PY465 and P < 0.002 for the adult region [δ, inter-δ-β, and β] for β-YAC mice). Representative examples of PCR-amplified ligation products are shown below the graph for evaluation of cross-linking frequencies. (B) Relative cross-linking frequencies observed in adult erythroid cells between the LCR EcoRI fragment and the rest of the locus. Adult bone marrow Ter119+ cells (n = 3/line) were analyzed from two PBGDAγ-YAC lines (PY367 and PY465) and the wild-type β-YAC line. The P values were determined by ANOVA (P < 0.03 for the fetal region [Gγ, inter-Gγ-Aγ, and Aγ or PBGDAγ] for line PY367 or PY465, but values were comparable for the adult region [δ, inter-δ-β, β, and 3′HS] for line PY367, PY465, or β-YAC). Representative examples of PCR-amplified ligation products are shown below the graph for evaluation of cross-linking frequencies.

