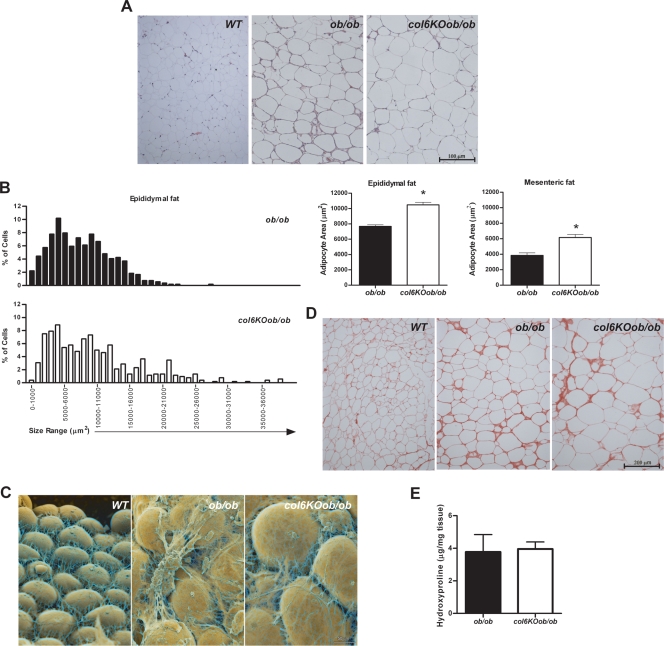
FIG. 4.
col6KOob/ob mice have larger adipocytes. (A) H&E-stained tissue sections of epididymal adipose tissue from col6KOob/ob mice and their ob/ob littermates. (B) The adipocyte area was calculated from epididymal and mesenteric adipose tissue sections using ImageJ software. The graph on the left shows the percentage of adipocytes in every 100-μm2 area range. Average adipocyte areas in epididymal and mesenteric fat are shown in the right panel. Adipocyte area was determined from four mice/group (>500 cells counted/group). *, P < 0.05 by Student's t test. (C) False-colored scanning electron micrographs of adipocytes from epididymal adipose tissue. (D) Sirius red staining of collagen from epididymal fat. (E) Hydroxyproline content of epididymal fat was measured as an indicator of total collagen content. All experiments (A to E) were performed on 8-week-old mice.

