FIG. 7.
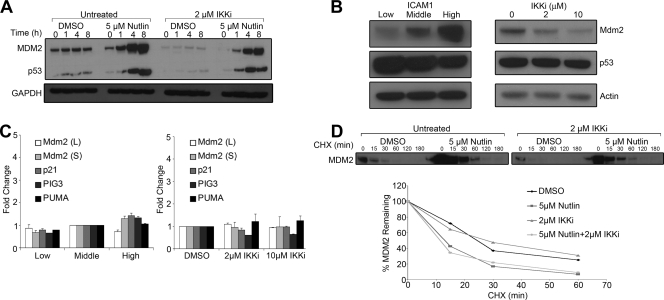
NF-κB activity modulates MDM2 protein levels in LCLs. (A) LCLs were treated with DMSO or 2 μM IKKβ inhibitor IV overnight. Then, cells were treated with either DMSO or 5 μM Nutlin-3 for the indicated amounts of time. Cells were lysed and blotted for MDM2, p53, and GAPDH. Cells preexposed to the IKK inhibitor overnight expressed lower levels of MDM2. (B) LCLs sorted as in Fig. 6C were lysed and immune-blotted for MDM2, p53, and actin. Similar to what is shown in Fig. 7A, MDM2 protein levels positively correlated with NF-κB activity. (C) LCLs sorted as in Fig. 6C and those treated with 2 μM or 10 μM IKK inhibitor for 24 h were subjected to quantitative RT-PCR for the following mRNAs: MDM2 (long), MDM2 (short), p21, PIG3, and PUMA. Values were normalized to 18S rRNA levels and are represented as either change relative to middle ICAM1 level (left) or change relative to DMSO-treated cells (right). (D) LCLs were treated with DMSO or 2 μM IKK inhibitor overnight, as in panel A, followed by DMSO or 5 μM Nutlin-3 treatment for 4 h. Cells were then washed, and fresh medium containing 75 μg/ml of cycloheximide was added to inhibit new protein synthesis. Protein samples were taken at the time points shown and immune-blotted for MDM2. Densitometry of the MDM2 band was performed using a Bio-Rad ChemiDoc gel documentation system and is plotted below the blot as the percentage of total MDM2 remaining over time.

