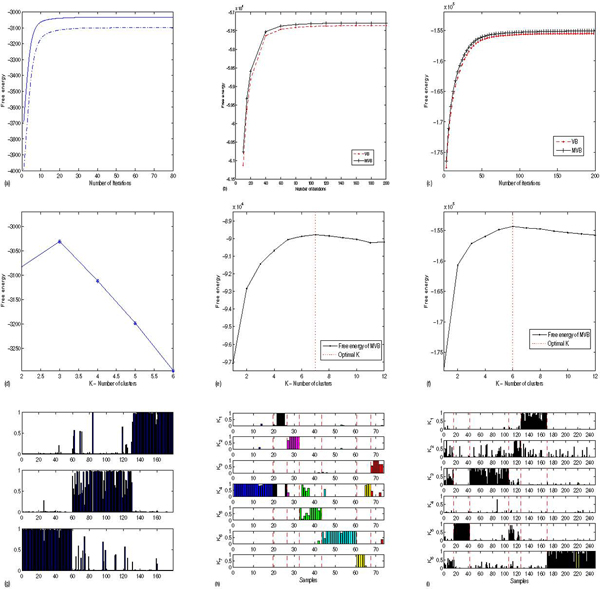
Figure 1.
Results for the wine data set (left column), lung cancer data set (middle column) and leukemia data set (right column). Top row (a-c): free energy bounds comparison (upper curve:MVB, lower curve:VB). Middle row (d-f): free energy (y-axis) versus , the number of clusters. Bottom row (g-i): the normalized ∑grdg, k gives a confidence measure that sample d belongs to a cluster k. For the two cancer datasets, samples separated by dashed lines belong to an identified class e.g. adenocarcinoma samples or small cell lung cancer samples (figure (h), see text).

