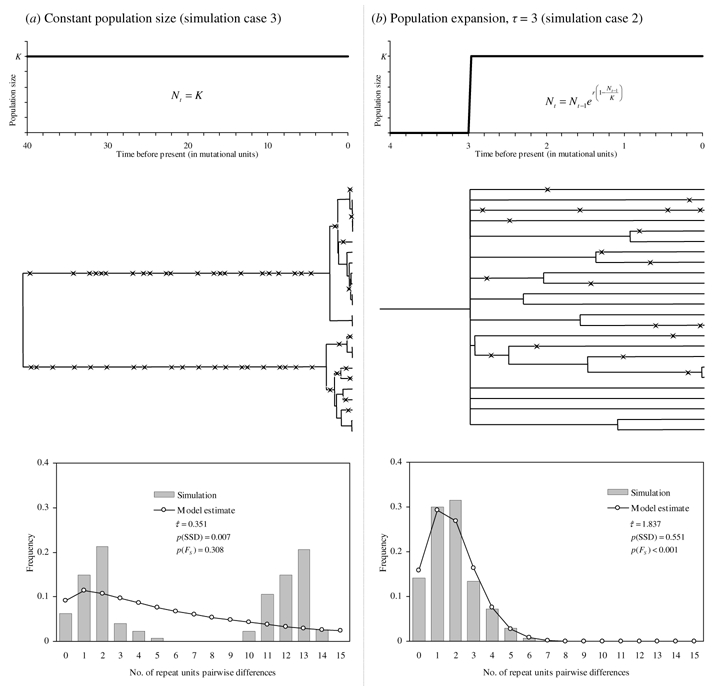
Figure 1.

Coalescent process under two contrasting scenarios: constant population size and sudden population expansion. For each case, the demographic history and, in the same timescale measured in mutational units (1 mutational unit = 1/2μ generations) the simulated genealogy of a random sample of genes is represented, with stars representing mutational events. Below, chloroplast microsatellite mismatch distribution and result of the FS test and demographic parameters estimates for those simulated samples are shown.
