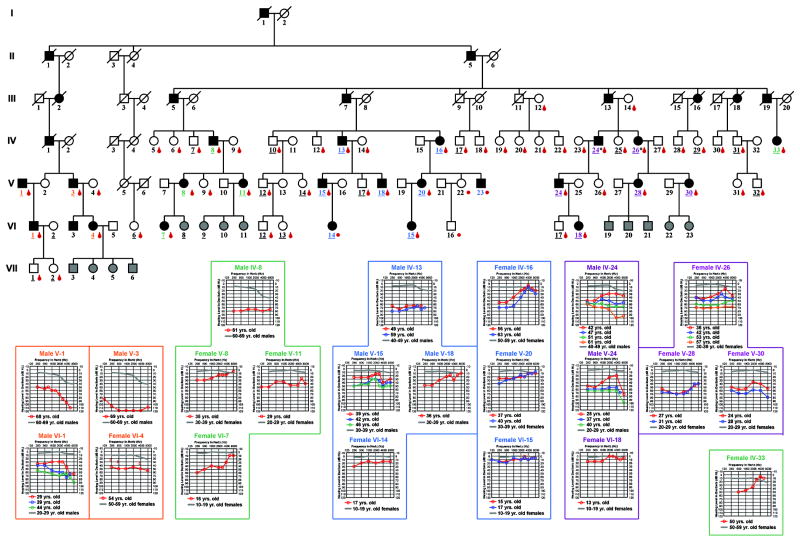
FIG. 2.
Audiologic characterization of the HL2 pedigree. Each individual in the pedigree is assigned a number by generation. Underlined numbers indicate the person completed an auditory evaluation. Affected individuals are denoted by blackened symbols, males by squares, females by circles, and deceased persons are indicated by a diagonal line through the symbol. If the auditory phenotype of a child is unknown, the symbol is filled in gray. Audiograms for affected individuals (shown for right ear only) are grouped as color-coded family clusters and positioned near the appropriate family branch. Frequency in hertz (Hz) is plotted on the x-axis and hearing level in decibels (dB HL) on the y-axis. Plotted on each audiogram (gray line) are the average pure-tone air conduction thresholds for a person with normal hearing (24) matched in age to the earliest audiogram collected for the HL2 family member.

