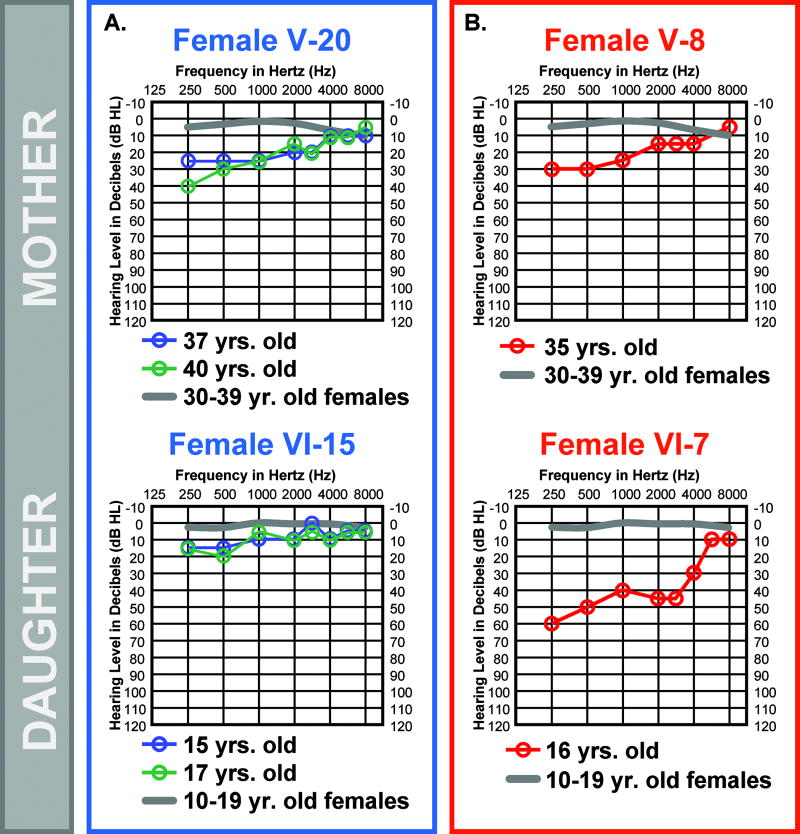
FIG. 5.
Comparison of hearing loss severity between HL2 family generations. Auditory thresholds are shown for the right ears only. Responses between the right and left ears were symmetrical. Frequency in hertz (Hz) is plotted on the x-axis and hearing level in decibels (dB HL) on the y-axis. Plotted on each audiogram (gray line) are the average pure-tone air conduction thresholds for a person with normal hearing matched in age to the earliest audiogram collected for the HL2 family member. (A) Mild HL2 auditory phenotype is maintained between mother (V-20) and daughter (VI-15). (B) Mild HL2 auditory phenotype is not maintained between mother (V-8) and daughter (VI-7).

