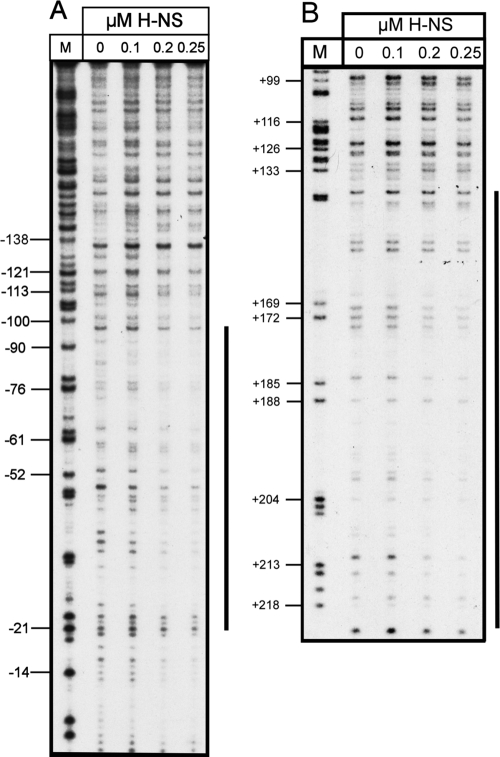
FIG. 4.
DNase I footprint analysis of H-NS binding to PR3. (A) Increasing concentrations of H-NS, as indicated above the tracks, were incubated with fragment C (Fig. 2) from plasmid pBlue-C (Table 1) labeled on the coding strand. Track M is a Maxam-Gilbert G track, and the numbering on the left is relative to the transcription start site. The extent of H-NS protection is depicted by the vertical line on the right. (B) Increasing concentrations of H-NS, as indicated above the tracks, were incubated with fragment H (Fig. 2) from plasmid pBlue-H (Table 1) labeled on the coding strand. Track M is a Maxam-Gilbert G track, and the numbering on the left is relative to the transcription start site. The extent of H-NS protection is depicted by the vertical line on the right.

