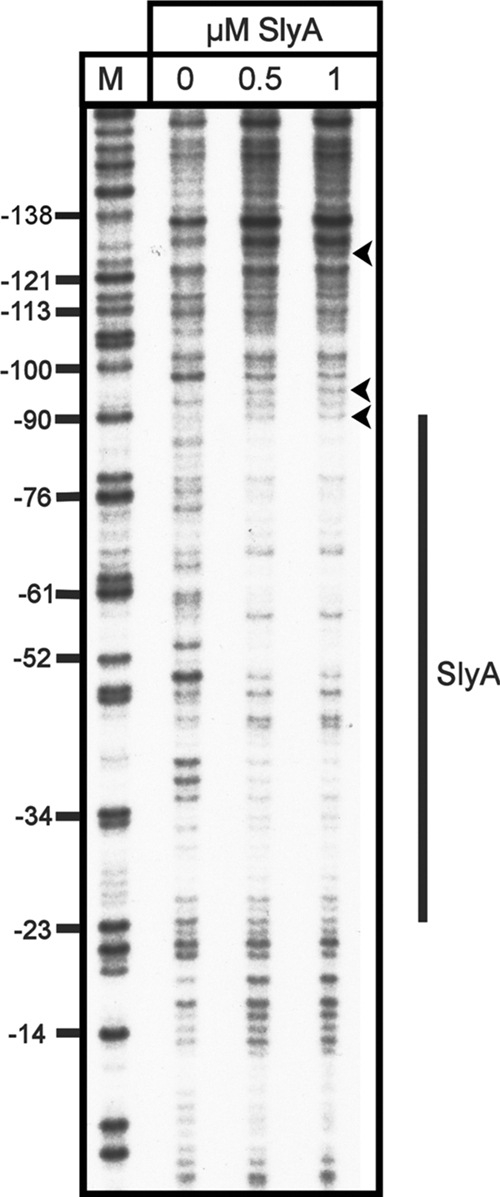
FIG. 6.

DNase I footprint analysis of SlyA binding to PR3. Increasing concentrations of SlyA, as indicated above the tracks, were incubated with fragment C (Fig. 2) from plasmid pBlue-C (Table 1) labeled on the coding strand. Track M is a Maxam-Gilbert G track, and the numbering on the left is relative to the transcription start site. The extent of SlyA protection is depicted by the vertical line to the right, and three hypersensitive sites are depicted by arrowheads.
