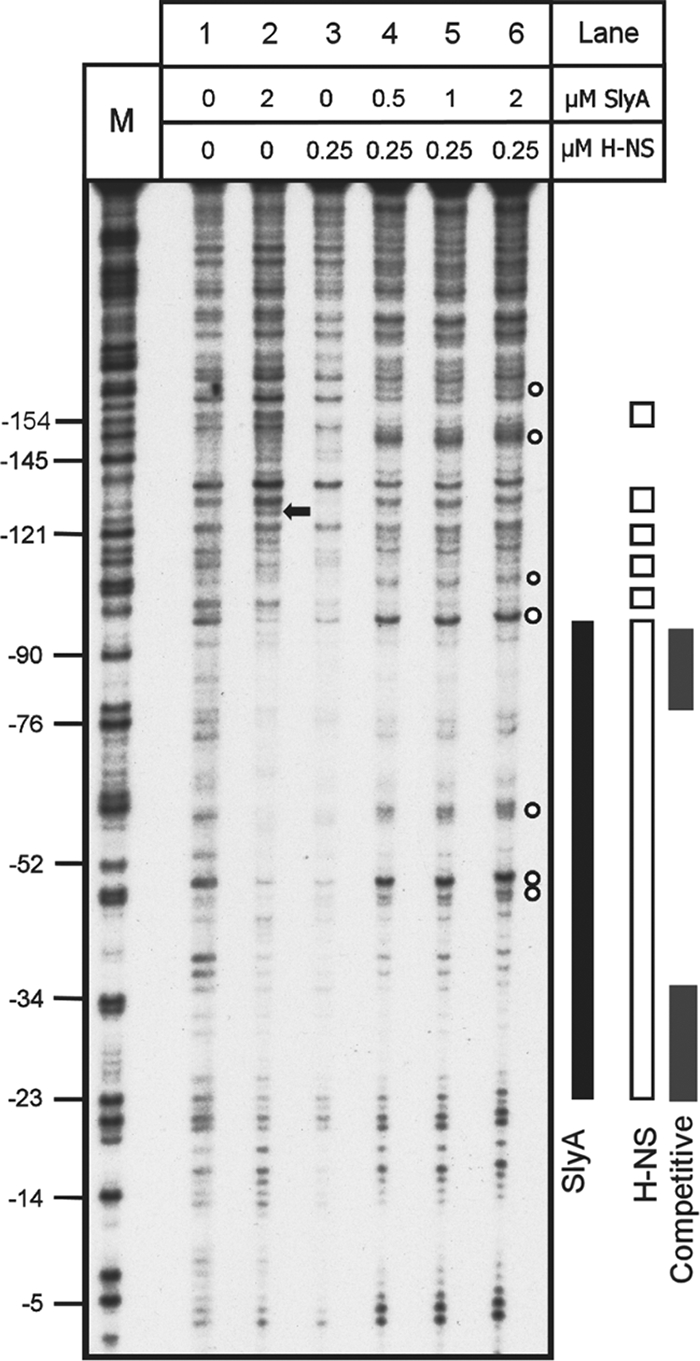
FIG. 7.

Competitive DNase I footprint analysis of PR3 with both H-NS and SlyA. Fragment C (Fig. 2) from plasmid pBlue-C (Table 1) was end labeled and incubated with SlyA, H-NS, or both at the concentrations indicated above the tracks and treated with DNase I. Track M is a Maxam-Gilbert G track, and the numbering on the left is relative to the transcription start site. Footprints are represented to the right by a solid black bar (SlyA), open bars (H-NS), and gray bars (competitive footprint H-NS and SlyA). The black arrow denotes a SlyA-dependent hypersensitive site that is lost in the combined footprint. The empty circles denote hypersensitive sites present in the combined footprint.
