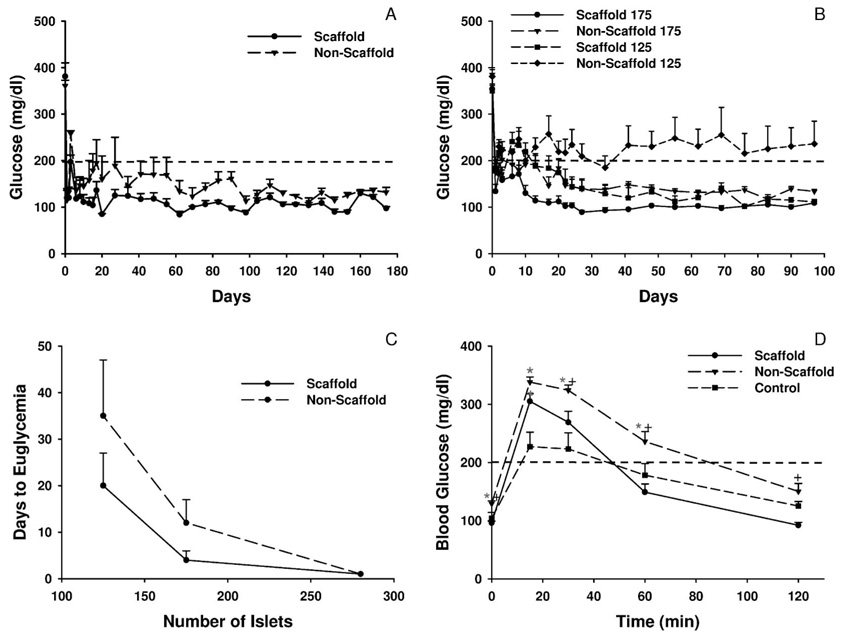
FIGURE 5.
(A) Transplantation of islets on a polymer scaffold. Diabetic male C57BL/6 mice were transplanted on day 0 with 280 islets without (nonscaffold group) or with (scaffold group) a polymer scaffold as described in the Materials and Methods. Euglycemia was defined as a sustained glucose value <200 mg/dl which is indicated by the dashed line. Values represent the mean glucose level at each time point (n = 3 for each group). (B) Transplantation of a marginal mass of islets. Diabetic male C57BL/6 mice were transplanted on day 0 with either 125 or 175 islets without or with a polymer scaffold. Values represent the mean glucose level at each time point (n = 8 for each group). (C) Mean number of days to euglycemia following islet transplantation. Values represent the mean number of days to euglycemia (the day of euglycemia was defined as the day on which a sustained glucose <200 mg/dl was achieved) for mice transplanted with the indicated number of islets without or with a polymer scaffold (n = 8 for each group except n = 5 for the 125 islet nonscaffold group). (D) Glucose values during an intraperitoneal glucose tolerance test. At 10 weeks posttransplant, an IPGTT was performed on the 175 islet scaffold and nonscaffold groups as well as age-matched male C57BL/6 control mice. Values represent the mean glucose levels at each time point (n = 8 for the scaffold and nonscaffold groups and n = 4 for the control group). *P≤0.01 compared to the control group; +P≤0.01 compared to the nonscaffold group.

