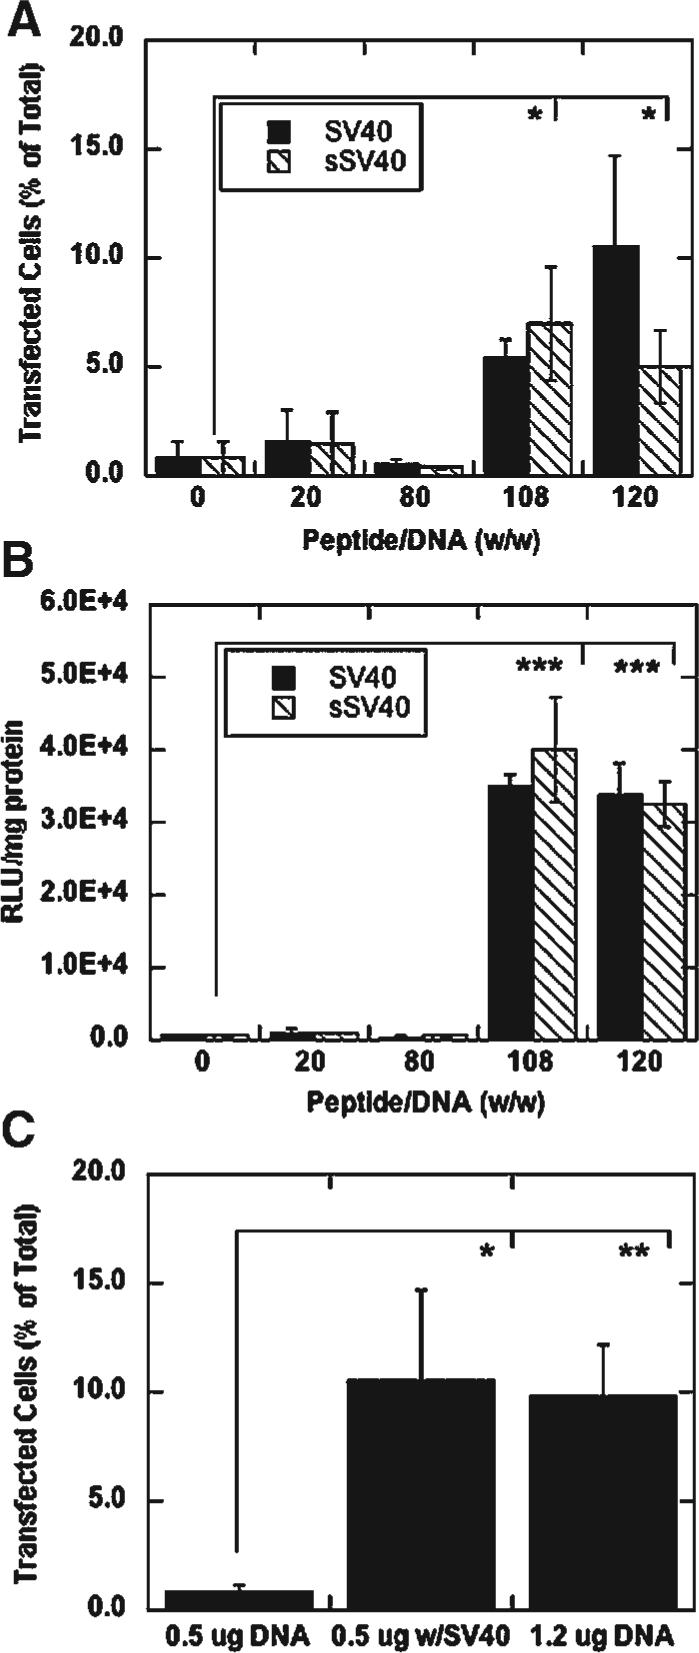
Figure 5.

Transfection at varying peptide/DNA ratios and DNA amounts. Percentage of cells transfected (A) and luciferase expression (B) of NIH/3T3 cells transfected with peptide-lipoplexes, 0.5 μg DNA per well, 10:1 lipid/DNA ratio (w/w), with varying amounts of SV40 and sSV40 peptide added. Percentage of NIH/3T3 cells transfected as a function of DNA added per well (C); the SV40 peptide/DNA ratio was 108 (w/w) and the lipid/DNA ratio was 10 (w/w). All values are reported as mean±standard deviation (*p < 0.05, **p < 0.01, ***p < 0.001).
