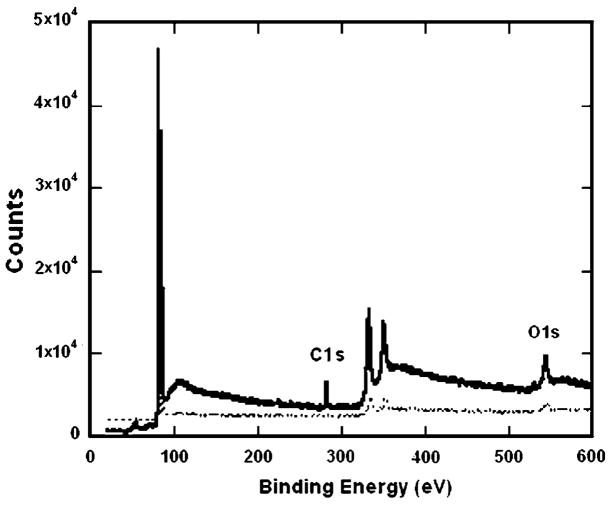
Fig. 1.
XPS verification of SAM formation. XPS spectrum of a MUA surface (—) relative to a gold surface (- - -) indicated increases in carboxylic acid groups at binding energy ~289 eV, characteristic of the carbon in the COOH groups. The O1s peak intensity further verified the presences of the carboxylic acid groups in the MUA sample.

