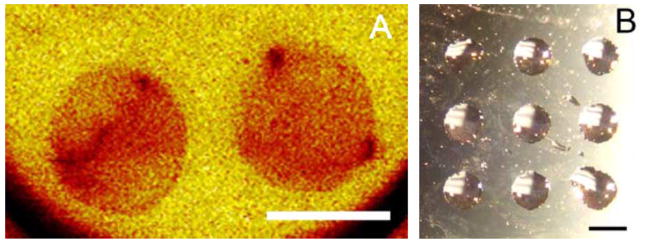
Fig. 6.
Microcontact printing on SAMS. (A) Secondary Ion Mass Spectrometry (SIMS) of stamped surface imaged the relative concentration of the mapped molecules, with red referring to higher concentrations of the hydrophilic alkanethiols. (B) Condensation figures created by pipeting water onto the stamped surface, which quickly collected in the hydrophilic regions. Gold-coated glass slides were used to prepare SAMs (Platypus Technologies, Madison, WI). Scale bars correspond to 1 mm.

