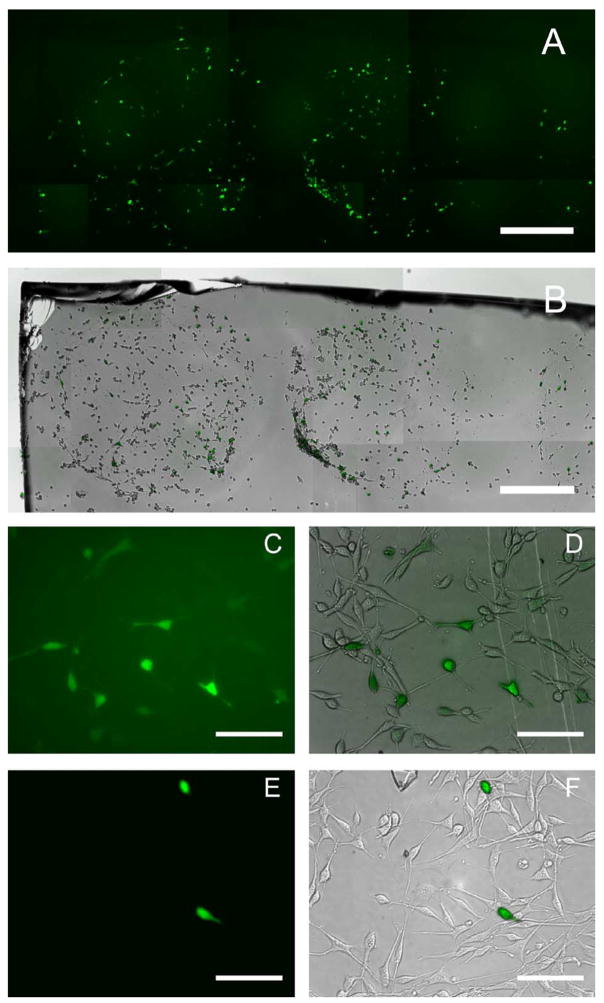
Fig. 8.
Patterned gene expression. Fluorescence and phase images were acquired and assembled to represent the entire patterned region (A, B). Transfection was confined to patterns and transfection efficiency within patterns was over 30%. Control transfections were performed on uniform 50% MUA (C, D) and DT10 (E, F) SAMs. Gold-coated glass slides were used for SAM preparation (Platypus Technologies). Scale bar corresponds to 500 μm (A, B) and 200 μm (C–F).

