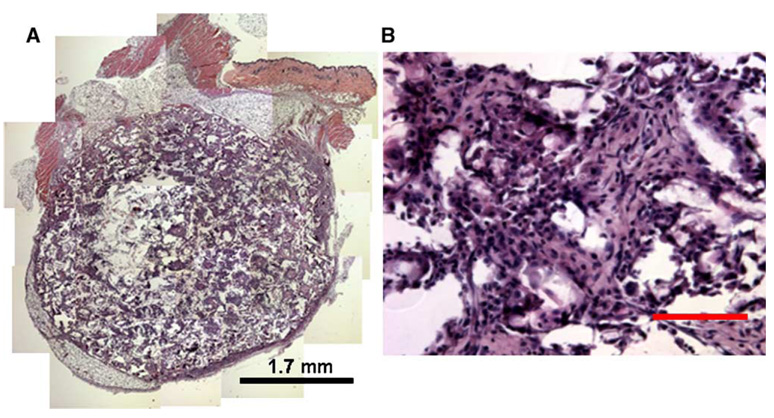
FIG. 2.
In vivo cellular infiltration throughout the scaffold. Images were taken of a scaffold retrieved after 17 days of implantation at (A) 50× and (B) 200×. For A, multiple images were assembled to represent the entire scaffold. Tissue sections were stained with hematoxylin and eosin. Scale bar, 100 µm.

