
Fig. 2.
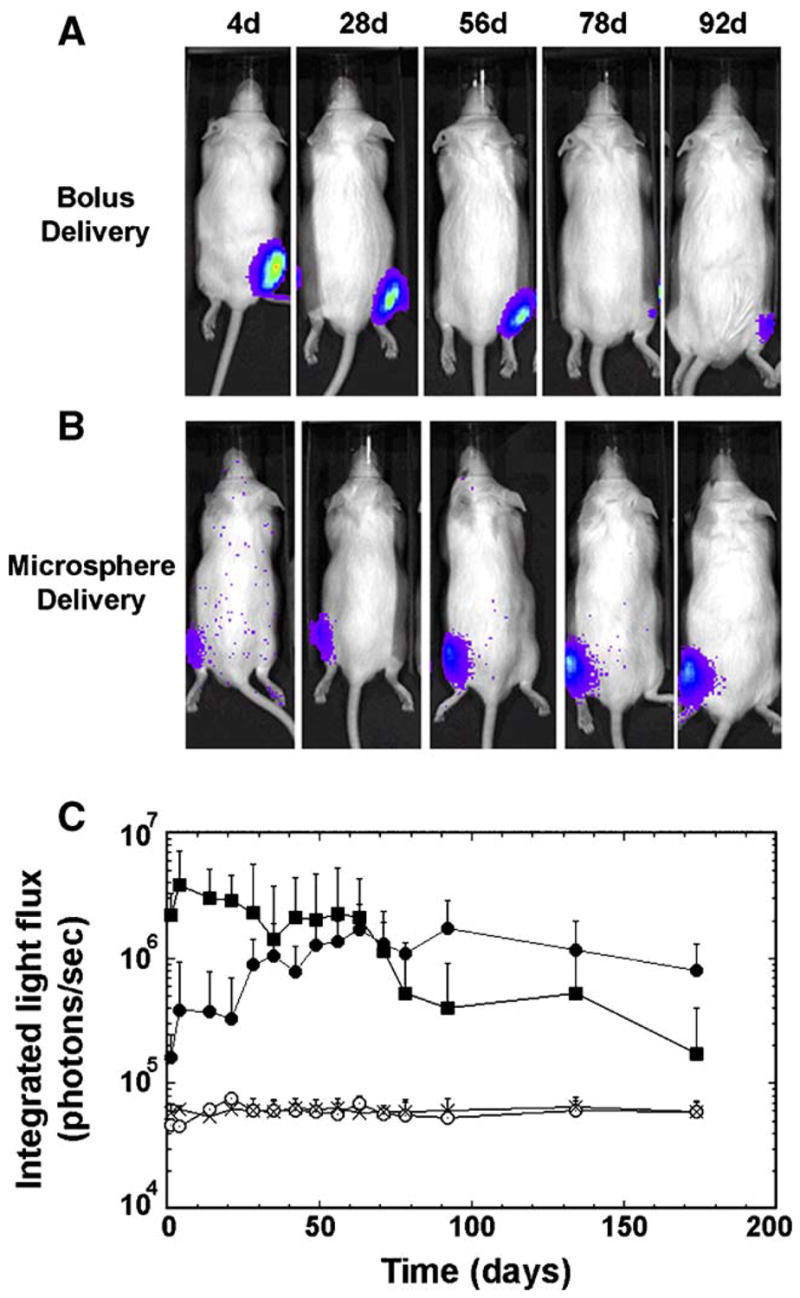
Bioluminescence imaging of intramuscular DNA delivery. pLuc (50 μg) was delivered as a bolus (A) or encapsulated within low MW PLG microspheres (B, 5 μg/mg microsphere). (A, B) Images showing a single mouse treated with bolus or microspheres at several time points. (C) CCD signal intensity (photons/s) for bolus delivery of pLuc (■), or microspheres with encapsulated pLuc. (●). Control conditions included microspheres without pLuc (x) and background light emission (○) (i.e., imaging before D-luciferin injection) (n=4).