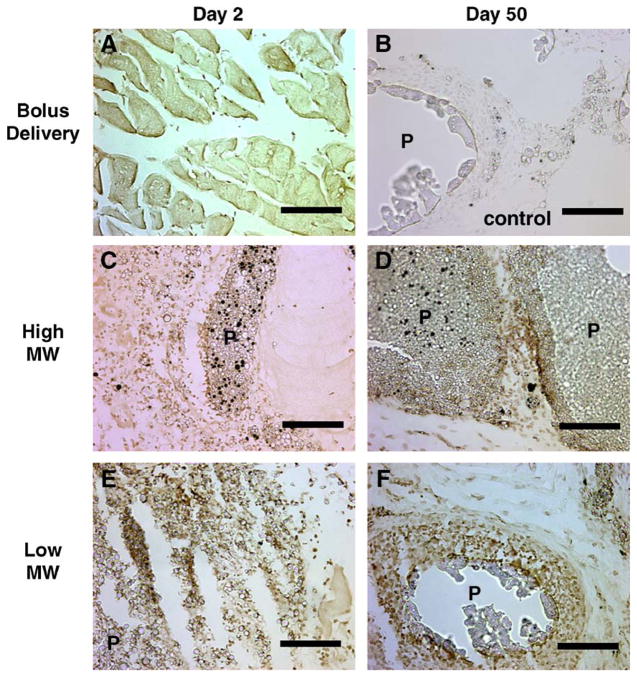
Fig. 7.
Immunohistochemical staining for luciferase expression at day 2 and day 50. Tissues were retrieved and sectioned at day 2 (A, C, E) or day 50 (B, D, F). The sections were stained following injection of plasmid as a bolus (A), and encapsulated within high MW (C, D) or low MW PLG microspheres (E, F). An example of control staining (no primary antibody) is shown (B). Magnification is 200× (A, C, D, E, F) and 400× (B). The label indicates polymers (P). Scale bar represents 100 μm (A, C, D, E, F) and 50 μm (B).

