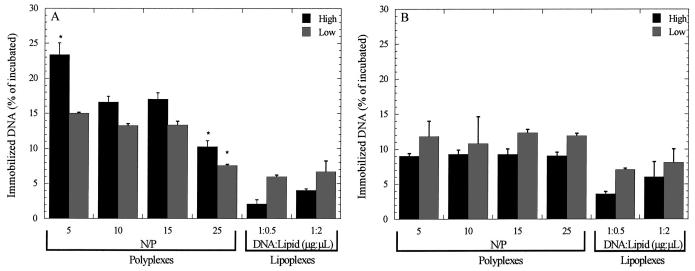
Figure 4.
DNA adsorption to surface. Polyplexes and lipoplexes were incubated on (A) PS and (B) FBS-PS surfaces for 2 h. Black bars indicate 2 μg, and gray bars indicate 0.5 μg of DNA incubated on the surface. Data are presented as average ± standard deviation of the mean. High doses have P < 0.05 relative to corresponding low doses at the same N/P (A). *P < 0.05 relative to other polyplex conditions.

