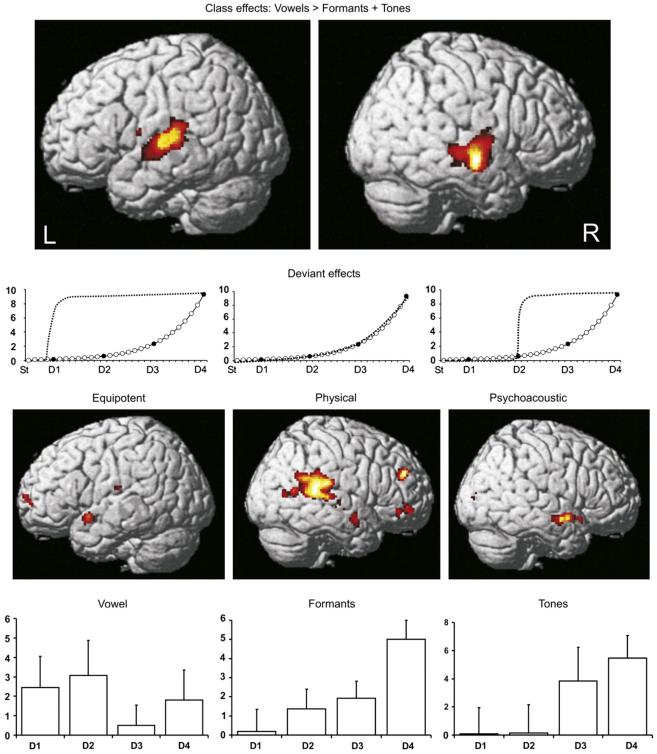
Fig. 3.
First row: fMRI results for main effects of class (threshold at p < .001, cluster size > 25 contiguous voxels). Activations are rendered onto the canonical single-subject brain template available in SPM5. L = left and R = right hemisphere responses to vowels > formants and tones. Second row: dotted lines show the ‘best-fit’ predictions of BOLD responses, i.e., the contrasts that were entered into the individual subjects’ design matrices to model each of the three deviant weightings: equipotent, psychoacoustic and physical. Third row: deviant effects (thresholded at p < .01, cluster size > 25 contiguous voxels). Forth row: measured, average BOLD responses (arbitrary units) with SEM bars relative to the standards of the same class. V = vowel deviants (left); F = formant deviants (middle); T = tone deviants (right) and D1-D4 = deviants.

