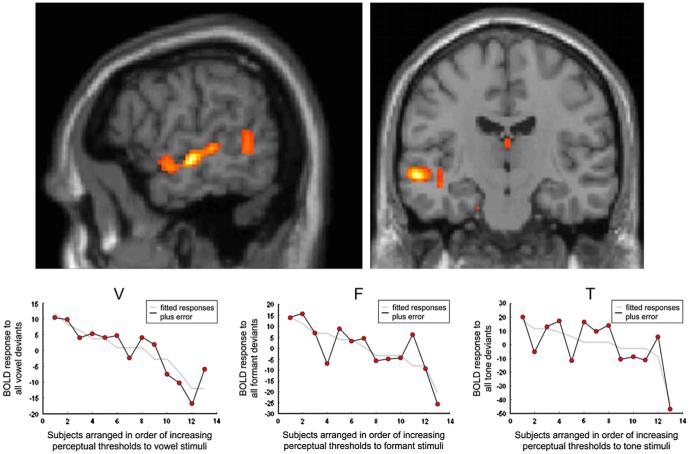
Fig. 4.
First row: fMRI results for the regression analysis of BOLD responses to all vowel deviants with perceptual thresholds (in ERB), across the 13 subjects. Activation is seen along the length of the left STS (threshold at p < .05, cluster size > 25 contiguous voxels). Second row: BOLD/ERB plots from the peak voxel for the vowel (V) analysis (mSTS) left; similar plots for the formant (F) and Tone (T) analyses, with the plots extracted from peak voxels near the vowel peak (see text).

