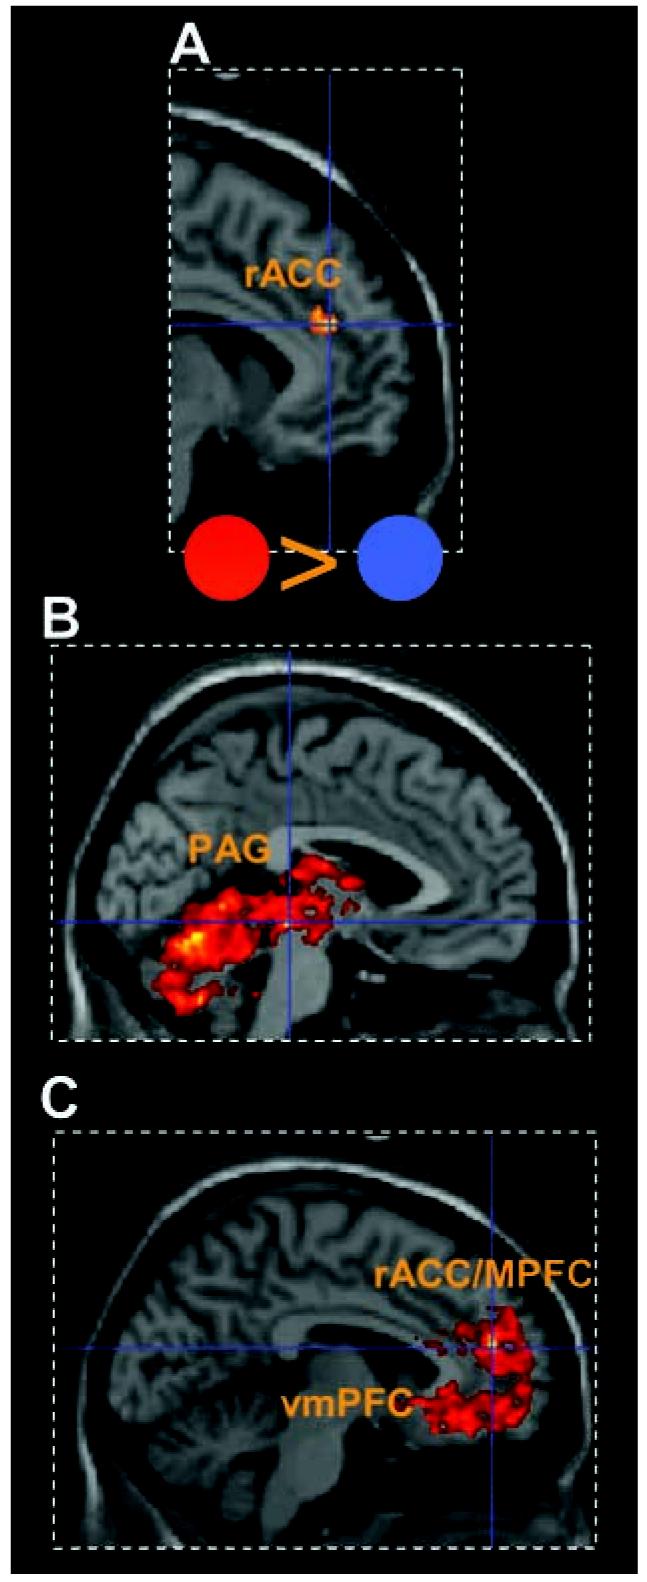
Fig. 2.

5tatistical parametric maps illustrating BOLD responses to the aversive cues and activation for the AIpredator conditions collapsed across blocks. Mean activity is shown for regions within 4 mm of peak. (A and B) Activity for the AIpredator (red circle) minus the AIneutral (blue circle) cue in (A) rACC and (B) periaqueductal gray (PAG) activity increased during allAIpredator blocks minus yoked blocks. (C) Activity in the rACC/mPFC and vmPFC (table 52) for yoked blocks minus AIpredator blocks.
