
Figure 3.
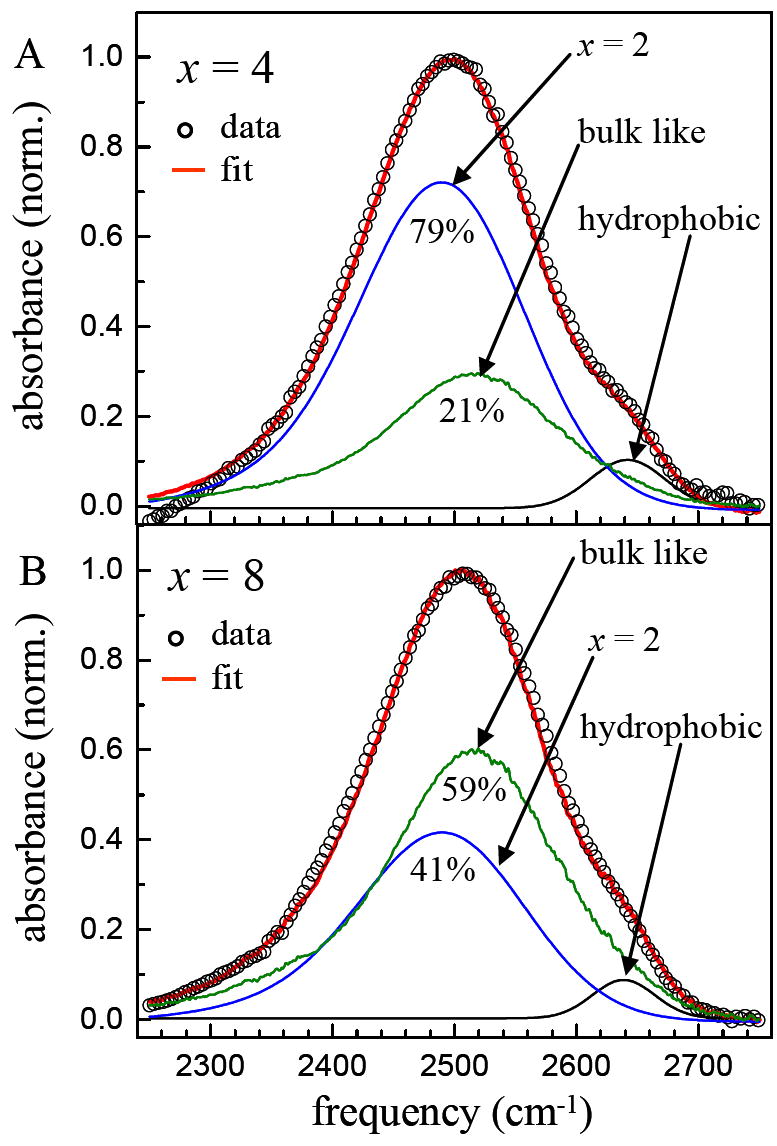
Examples of fitting the absorption spectra for x = 4 (panel A) and x = 8 (panel B). The data (circles) can be fit (red line) by the sum of the spectra of x = 2 and bulk water. Only the relative amplitude of the two spectra is varied. A third small Gaussian peak is included to account for the high frequency shoulder associated with water molecules in hydrophobic regions of the bilayers.