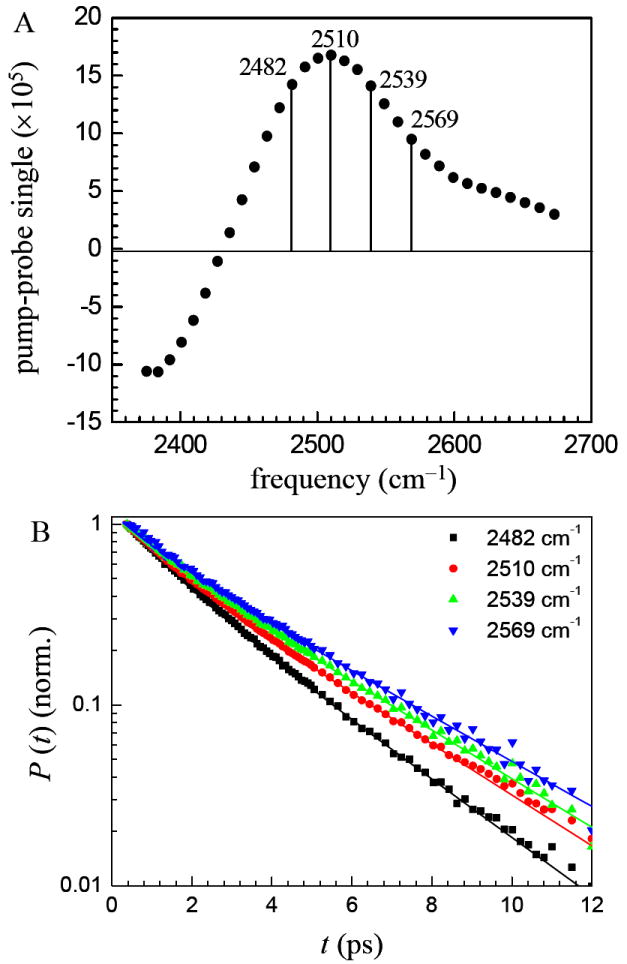
Figure 6.

A. Pump-probe spectrum of the OD stretch of HOD in H2O in bilayers with x = 4 at 0.24 ps. The signal is positive in the 0-1 vibrational transition frequency range and negative in the 1-2 range. B. Vibrational population decays at the four frequencies indicated in A. The decays are wavelength dependent. The solid curves are biexponential fits to the data.
