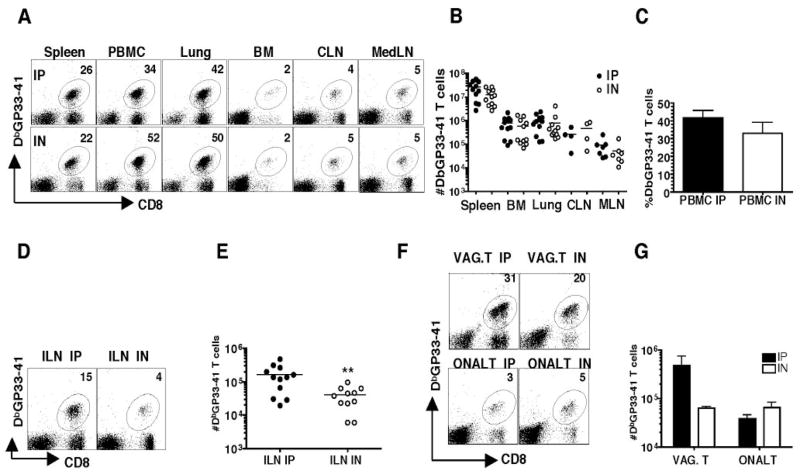
Figure 1.
Magnitude of the Ag-specific CD8 T cell response differs in the genital tract on day 8. Lymphocytes from spleen, peripheral blood, lung, bone marrow, CLN, MedLN, ILN, vaginal tract, and o-NALT were isolated and surface stained with DbGP33–41, CD8. A, Representative FACS staining of tissues from a day 8 postinfection LCMV Armstrong i.p. or i.n. infected mouse. The numbers represent the percentage of Ag-specific CD8 T cells in the indicated tissue compartment. B, Total number of Ag-specific CD8 T cells in tissues. C, Percentage of Ag-specific CD8 T cells in PBMC. D, Representative staining and E, Total numbers of Ag-specific T cells in the ILN. F, Representative staining and G, Total number of Ag-specific CD8 T cells in the vaginal tract and o-NALT. Black/filled symbols are i.p. and white/open symbols are i.n. The data represent three experiments; for o-NALT and vaginal tract tissues are pooled from four animals, each experiment. Not shown are uninfected control mice that showed no detectable Ag-specific responses.**, p < 0.01.

