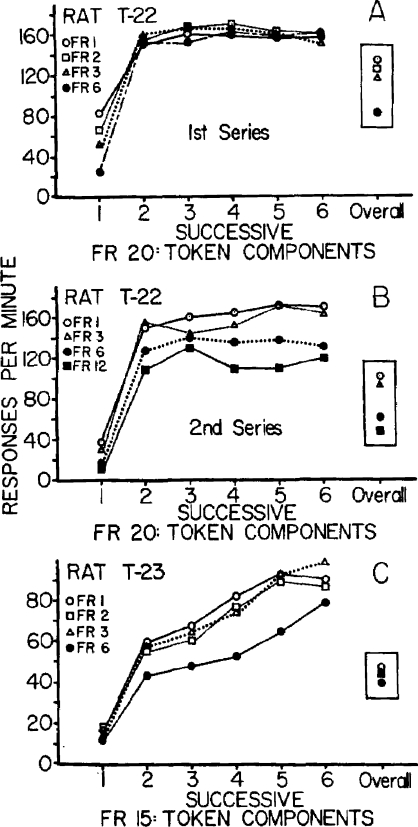
Fig. 7.
Response rates across successive FR token-production segments as a function of token-exchange FR for 2 rats. Overall mean response rates are shown on the right-hand side of each plot. From Malagodi, Webbe, & Waddell (1975). Copyright 1975, by the Society for the Experimental Analysis of Behavior, Inc. Reprinted with permission.

