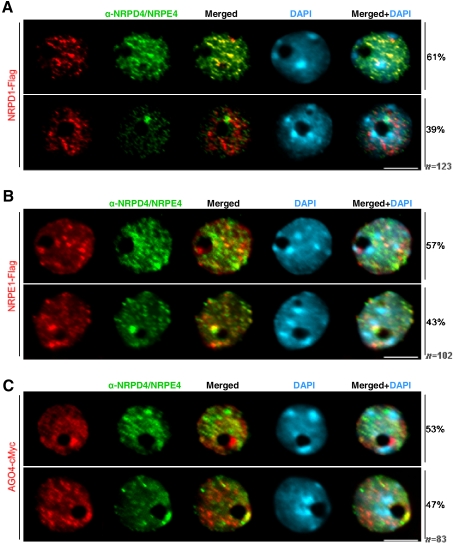
Figure 7.
Colocalization of NRPD4/NRPE4 with Pol IV, Pol V, and AGO4. Immunofluorescence of NRPD4/NRPE4 (green) in transgenic lines expressing full-length epitope-tagged NRPD1 (A), NRPE1 (B), and AGO4 (C) (all in red). The merged images reveal bright yellow signals due to the overlap of red and green channels. The frequency of nuclei displaying each interphase pattern is shown to the right. Nuclear DNA is stained with DAPI (blue). Bar, 5 μm.

