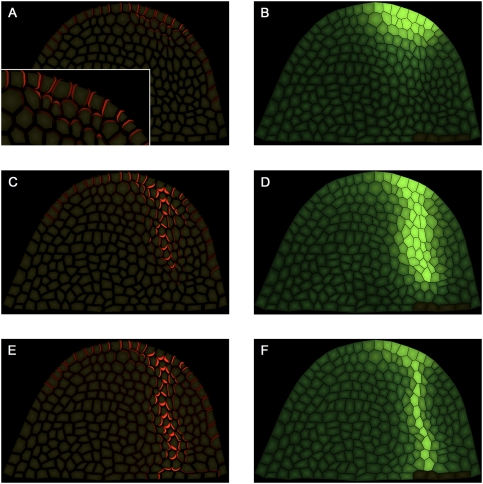
Figure 7.
Simulation model of midvein formation on a cellular meristem template. (A,C,E) PIN1 protein localization shown in red at different time points of the simulation. (B,D,F) IAA concentration shown in green at the same time points of the simulation. Dark cells at the bottom right are sinks for auxin and represent pre-existing vasculature. (A, inset) The closeup shows apical polarization of PIN1 in the initial stages of midvein formation. Simulation times were 2 h (A,B), 5 h (C,D), and 12 h (E,F).

