
Figure 1.

Radius of gyration ( ) versus time for the P4–P6 subdomain. The points are calculated from fits to the Guinier region of the data (Guinier & Fournet, 1955 ▶), with the errors being determined by the 95% confidence intervals. The black line is the fit of the equation
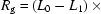
 with
with  ,
,  and
and  ms. When measured by SAXS, P4–P6 folding is accurately described by a single exponential; thus the global compaction of P4–P6 is apparently a two-state process.