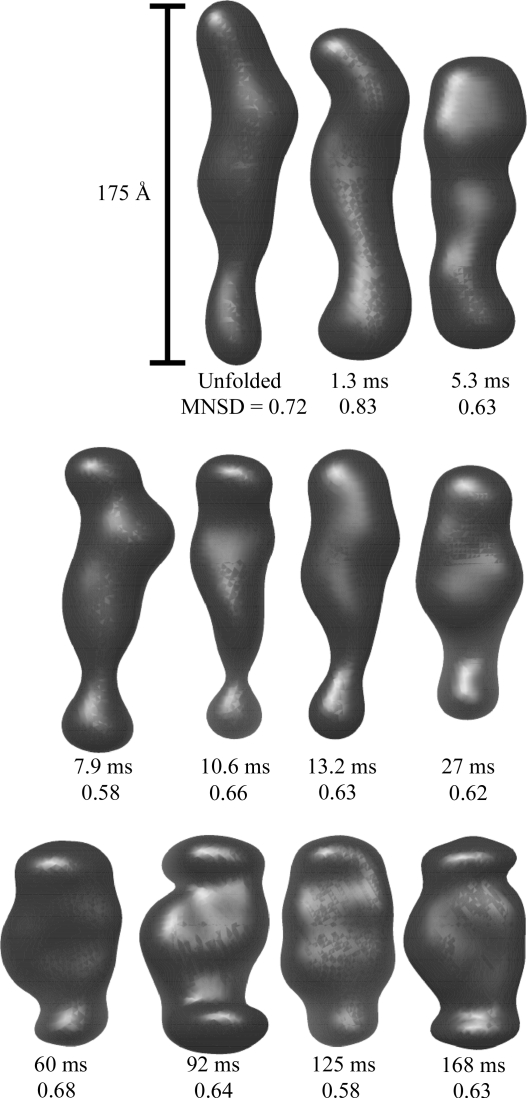
Figure 2.
Averaged reconstructions of the P4–P6 subdomain. Each shape is labeled with the time elapsed since mixing and the MNSD value that reflects the uniqueness of the reconstruction. While the MNSDs of two shapes are larger than 0.7, examination of the individual reconstructions (not shown) confirms that the averages represent the ensembles. All reconstructions are depicted on the same spatial scale.

