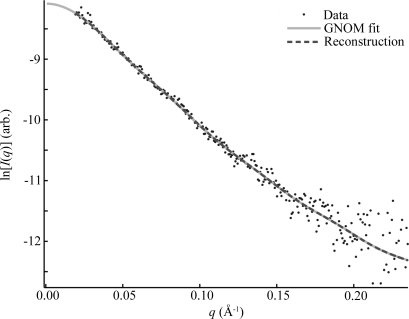
Figure 4.
GNOM and DAMMIN fits to the experimental data. This plot demonstrates the quality of typical fits to the data by both GNOM and DAMMIN. The dots represent 10.6 ms P4–P6 folding data, which have been scaled by a beam intensity monitor to account for small changes in X-ray intensity. The solid line is the GNOM fit to this data, and the dashed line is calculated from a single reconstruction, both of which are scaled to match the data by the programs that produced them. The curve found by GNOM fits the data well within the noise, but the noise is large compared with the precision of the reconstruction, which leaves room for error. DAMMIN and GNOM curves are indistinguishable, demonstrating how precisely the reconstruction fits the GNOM representation of the data. The consequences of these observations are discussed in the text.

