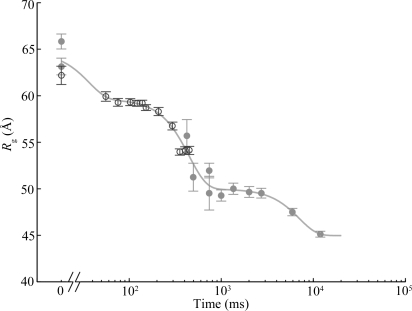
Figure 5.
Folding time course for the full-length ribozyme. The points are calculated from a fit to the Guinier region of the data (Guinier & Fournet, 1955 ▶), with the errors being determined by the 95% confidence intervals. The solid line is a fit to the expression  =
= 
 +
+  +
+  +
+  , where
  ,
,  ,
,  ,
,  ,
,  ms,
ms,  ms and
  ms. Radius of gyration versus time for the Tetrahymena ribozyme shows two long-lived intermediates on the folding pathway. Open circles correspond to data points acquired at the APS with the continuous-flow mixer; filled circles represent data collected with a stopped-flow mixer at CHESS.

