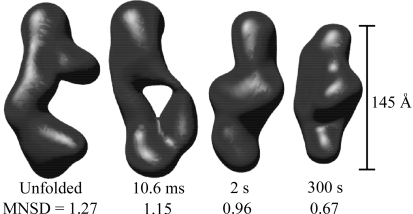
Figure 6.
Reconstructions for selected time points during folding of the full-length ribozyme. This figure indicates the time elapsed since mixing and shows the MNSD between ten individual reconstructions of scattering states along the folding pathway of the ribozyme. The initial and final states are shown, along with two states that correspond to the measured plateaus in the curve of  versus time.

