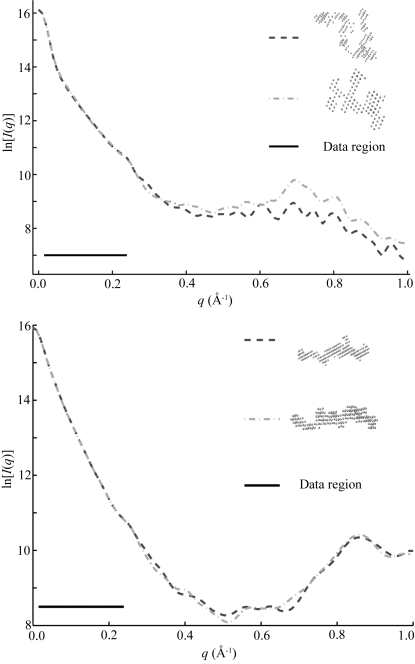
Figure 8.
Variations between reconstructions from the same SAXS data. This figure shows calculated scattering intensities for the most widely varying reconstructions of the scattering data representing unfolded molecules. The black line in both figures indicates the range over which we have acquired data, from approximately  Å
Å to
to  Å
Å . Top: Although these reconstructed models for the full-length ribozyme are very different, we note that the scattering profiles of both of these models agree well with our measurements (data not shown) and with each other within the data range. Discrepancies that are evident outside of the scattering regime might indicate there is more information to gather at larger
  . Bottom: For P4–P6 reconstructions the agreement is excellent both within and beyond the data range.

