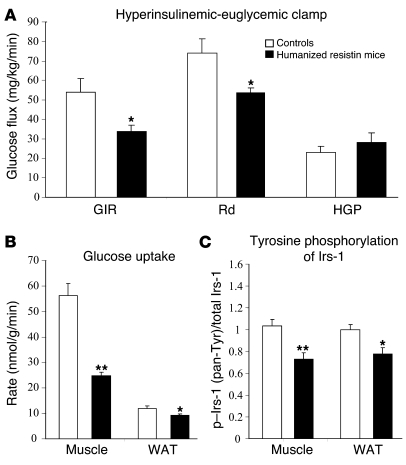
Figure 3. Humanized resistin mice are insulin resistant.
(A) Hyperinsulinemic-euglycemic clamp analysis of humanized resistin mice versus Retn–/– controls. (B) Rate of insulin-stimulated glucose uptake in muscle and WAT. (C) Insulin-stimulated tyrosine phosphorylation of IRS-1 in muscle and WAT normalized to controls. Rd, rate of glucose disposal; HGP, hepatic glucose production; pan-Tyr, pan tyrosine. *P < 0.05; **P < 0.01. Data are expressed as mean ± SEM; n = 8.

