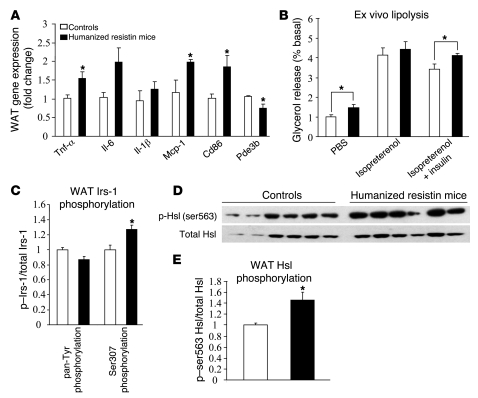
Figure 6. WAT inflammation and lipolysis precede the muscle changes in humanized resistin mice.
(A) Gene-expression analysis in WAT of humanized resistin and control mice after short-term (4-day) high-fat–diet feeding. (B) Ex vivo lipolysis measured by glycerol release normalized to PBS-treated samples from control mice. (C) Pan tyrosine and ser307 phosphorylation of WAT IRS-1 normalized to controls. (D) Western blot analysis of Hsl ser563 phosphorylation in WAT of humanized resistin mice compared with control mice. (E) Quantitation of the blot in D normalized to controls. p-ser563, phosphor-ser563. *P < 0.05. Data are expressed as mean ± SEM; n = 6–8.

