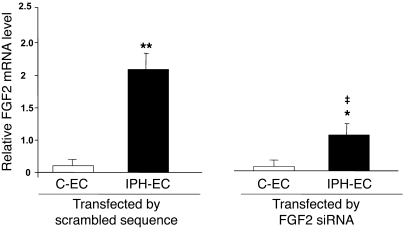
Figure 2. FGF2 mRNA level in P-ECs assessed by real-time quantitative PCR.
FGF2 mRNA levels assessed by real-time quantitative PCR in P-ECs obtained from lungs of patients with IPH or controls and treated with FGF2-siRNA or the scrambled siRNA sequence. Values are mean ± SEM from 5 controls and 5 patients with IPH. *P < 0.05; **P < 0.001 vs. P-ECs from control subjects; ‡P < 0.01 between P-ECs treated with FGF2-siRNA vs. scrambled siRNA sequence.

